Purpose and Objective
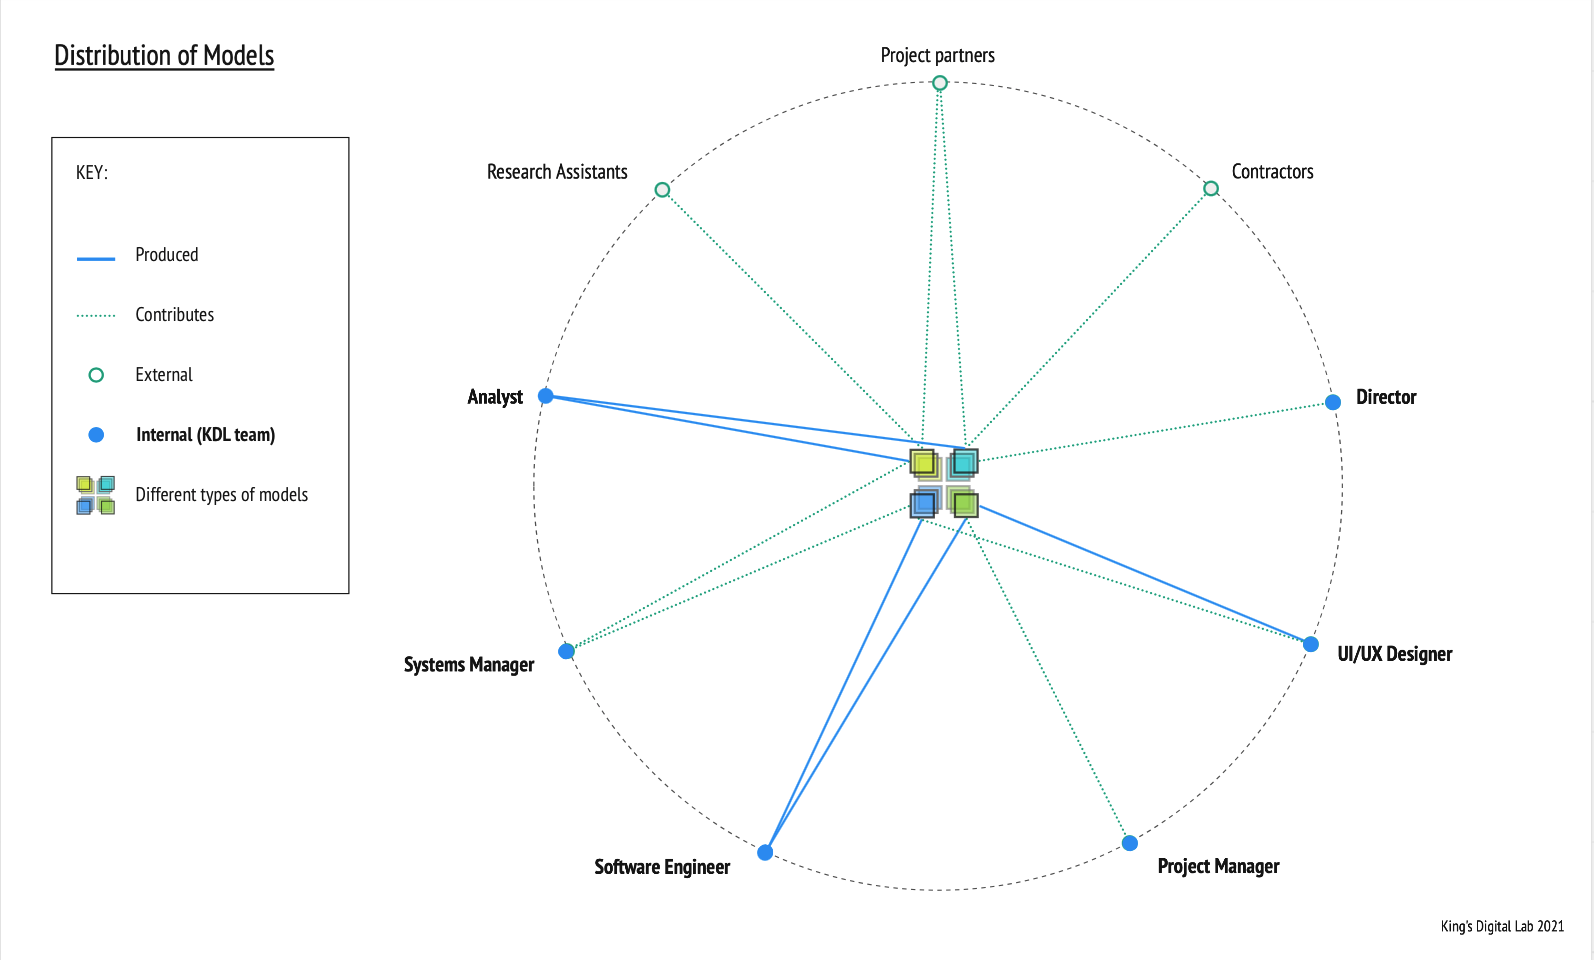
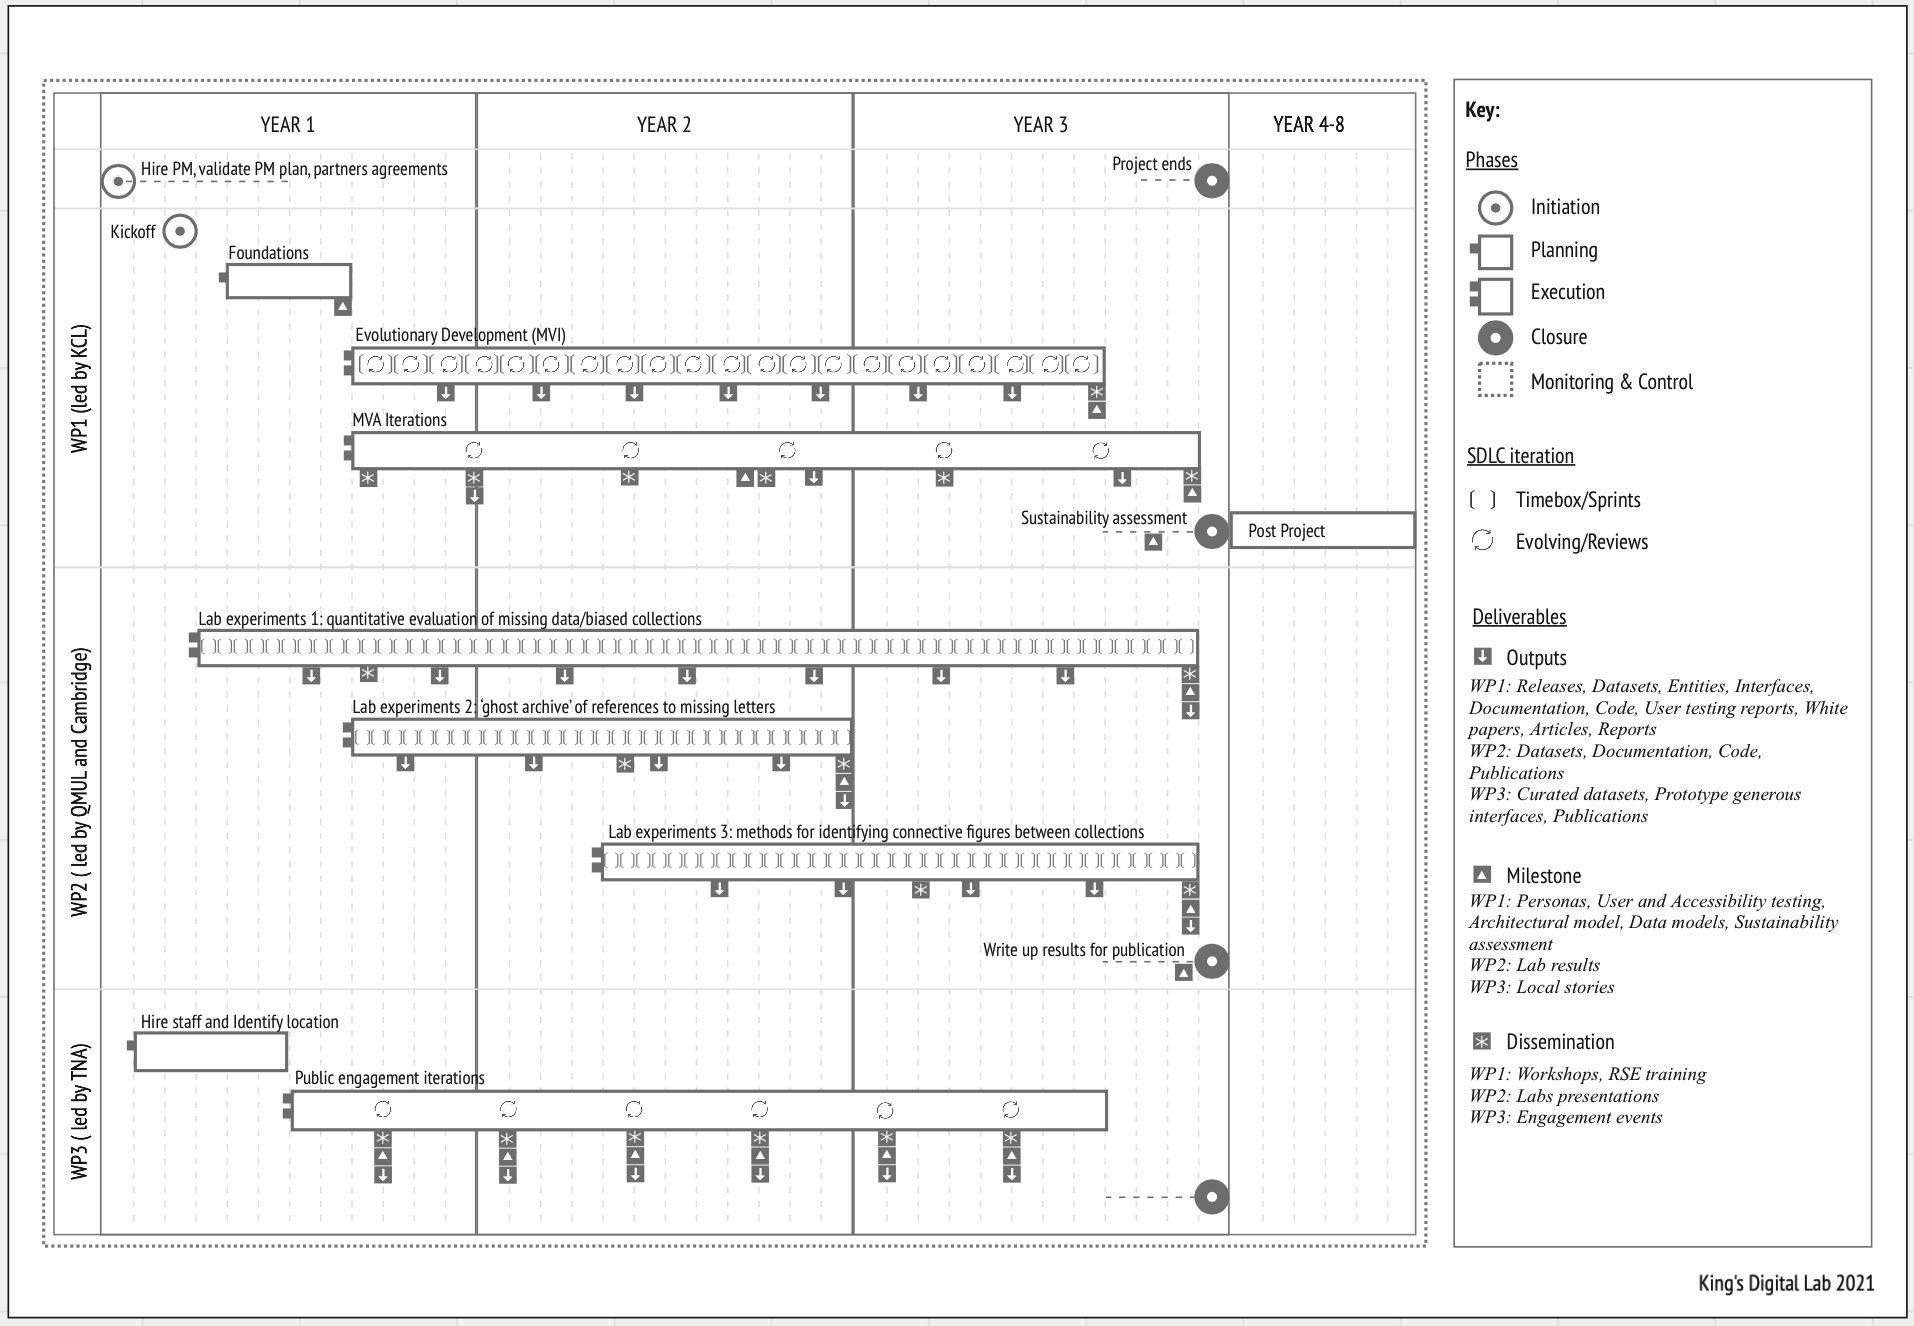
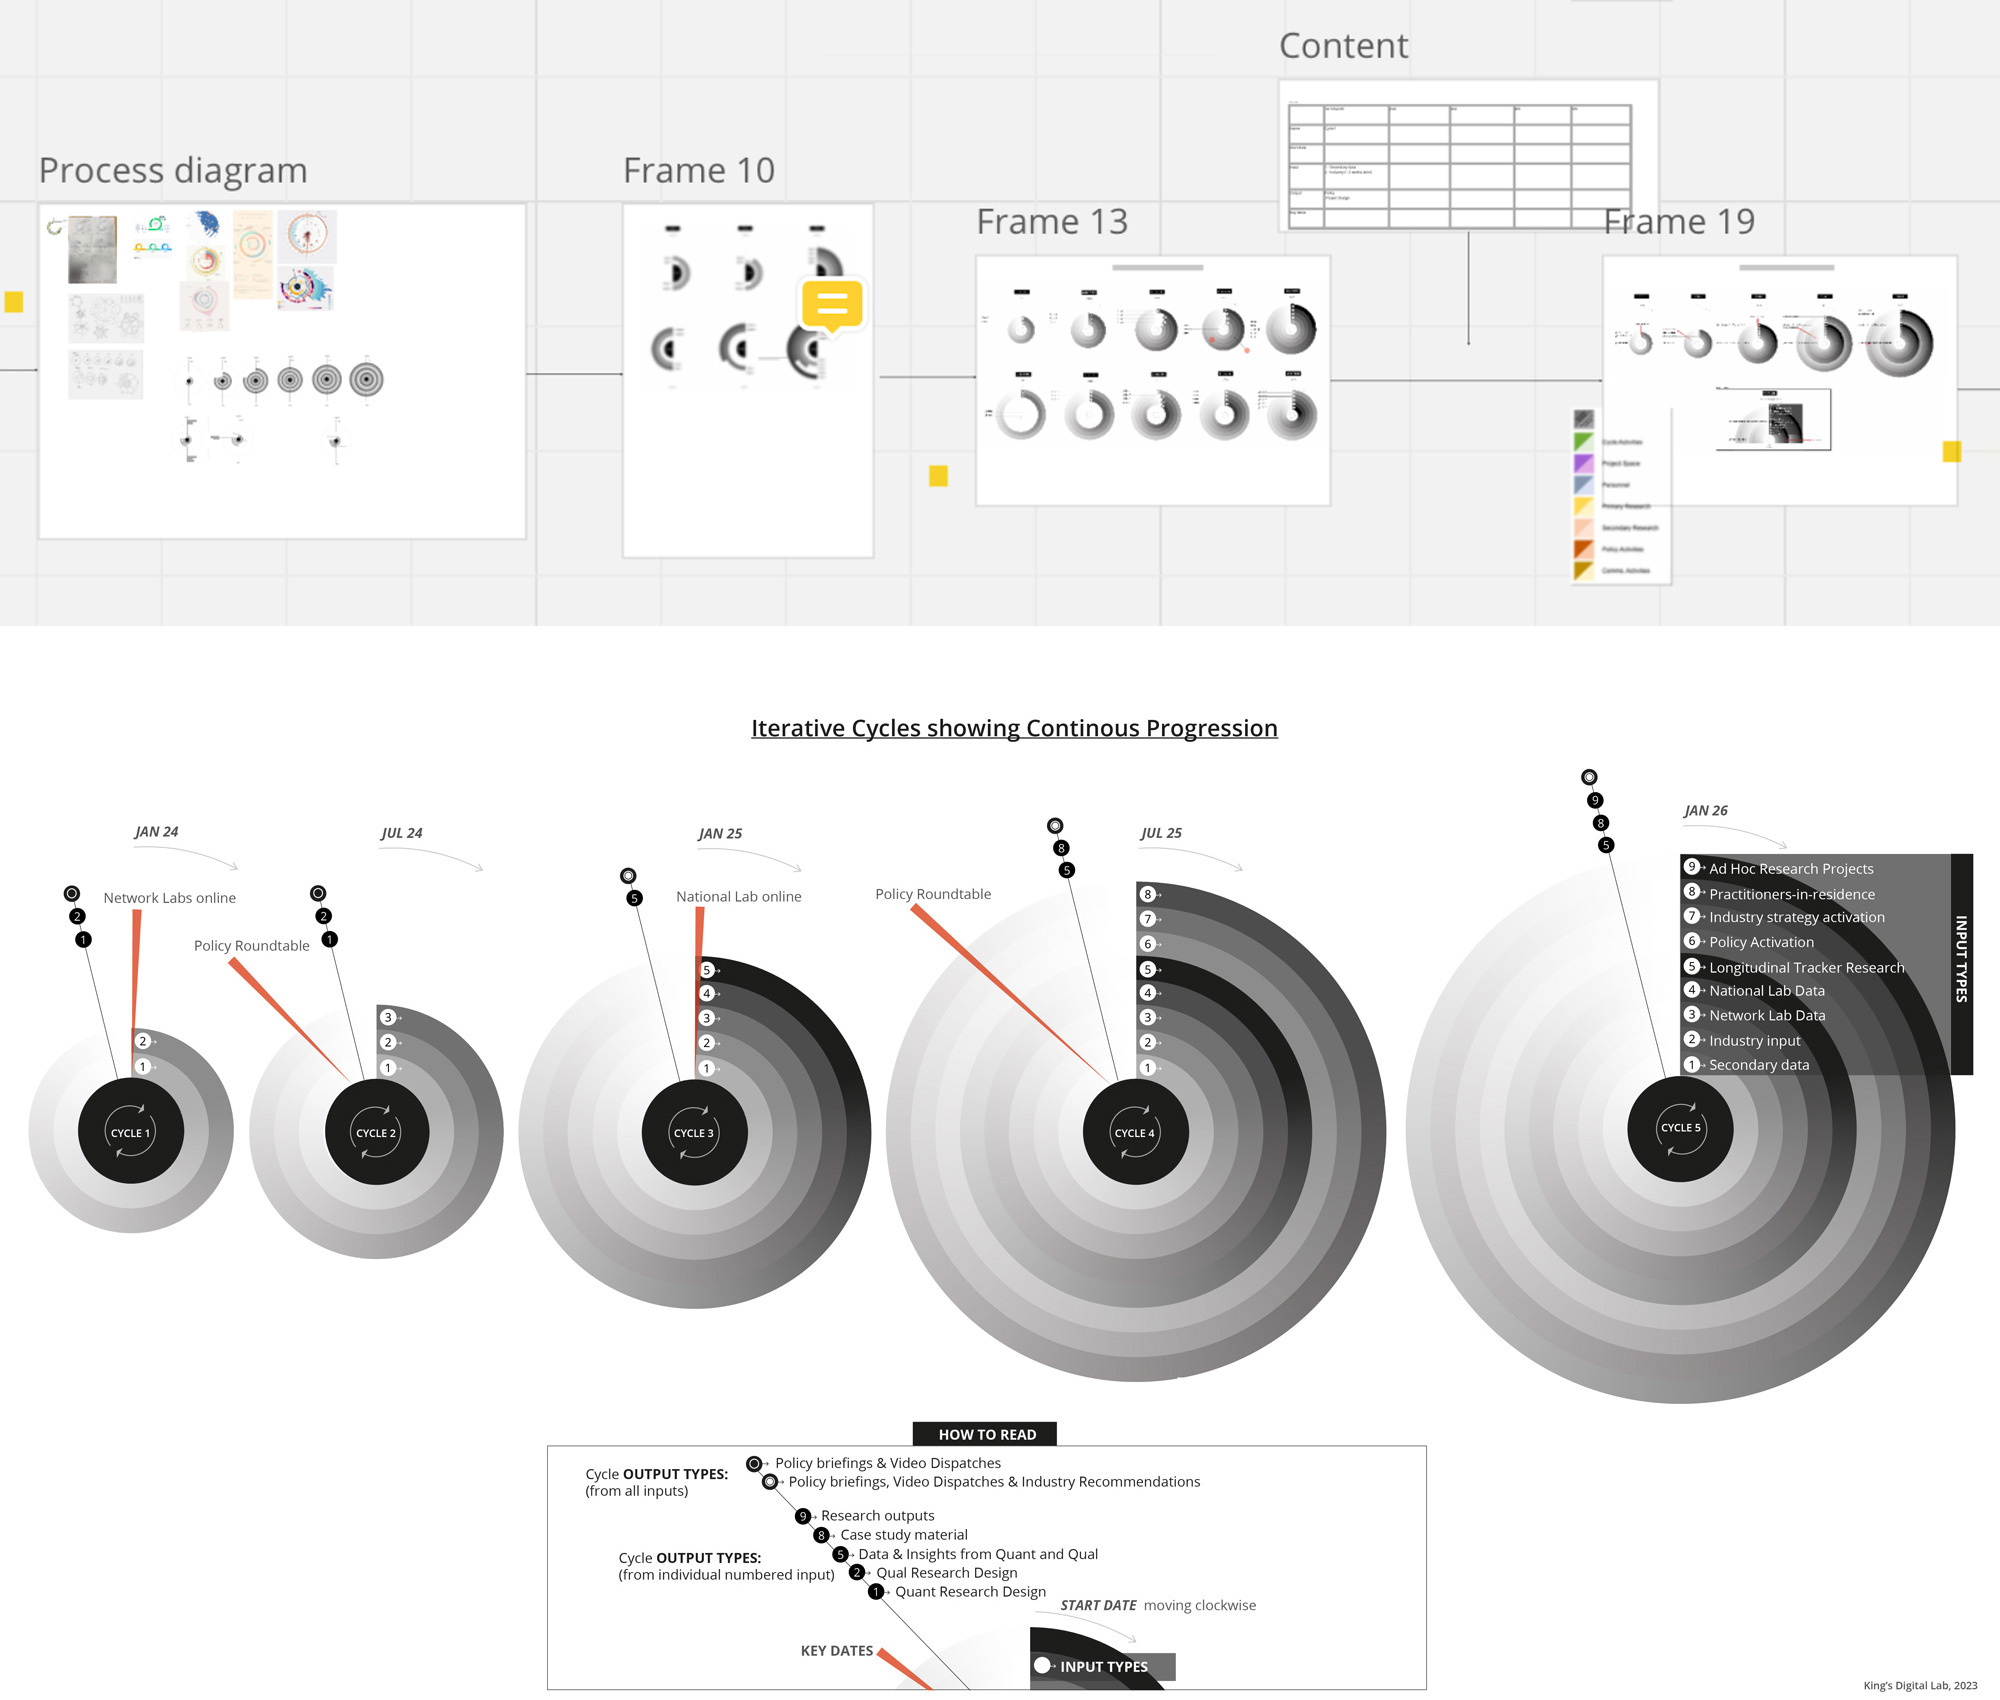
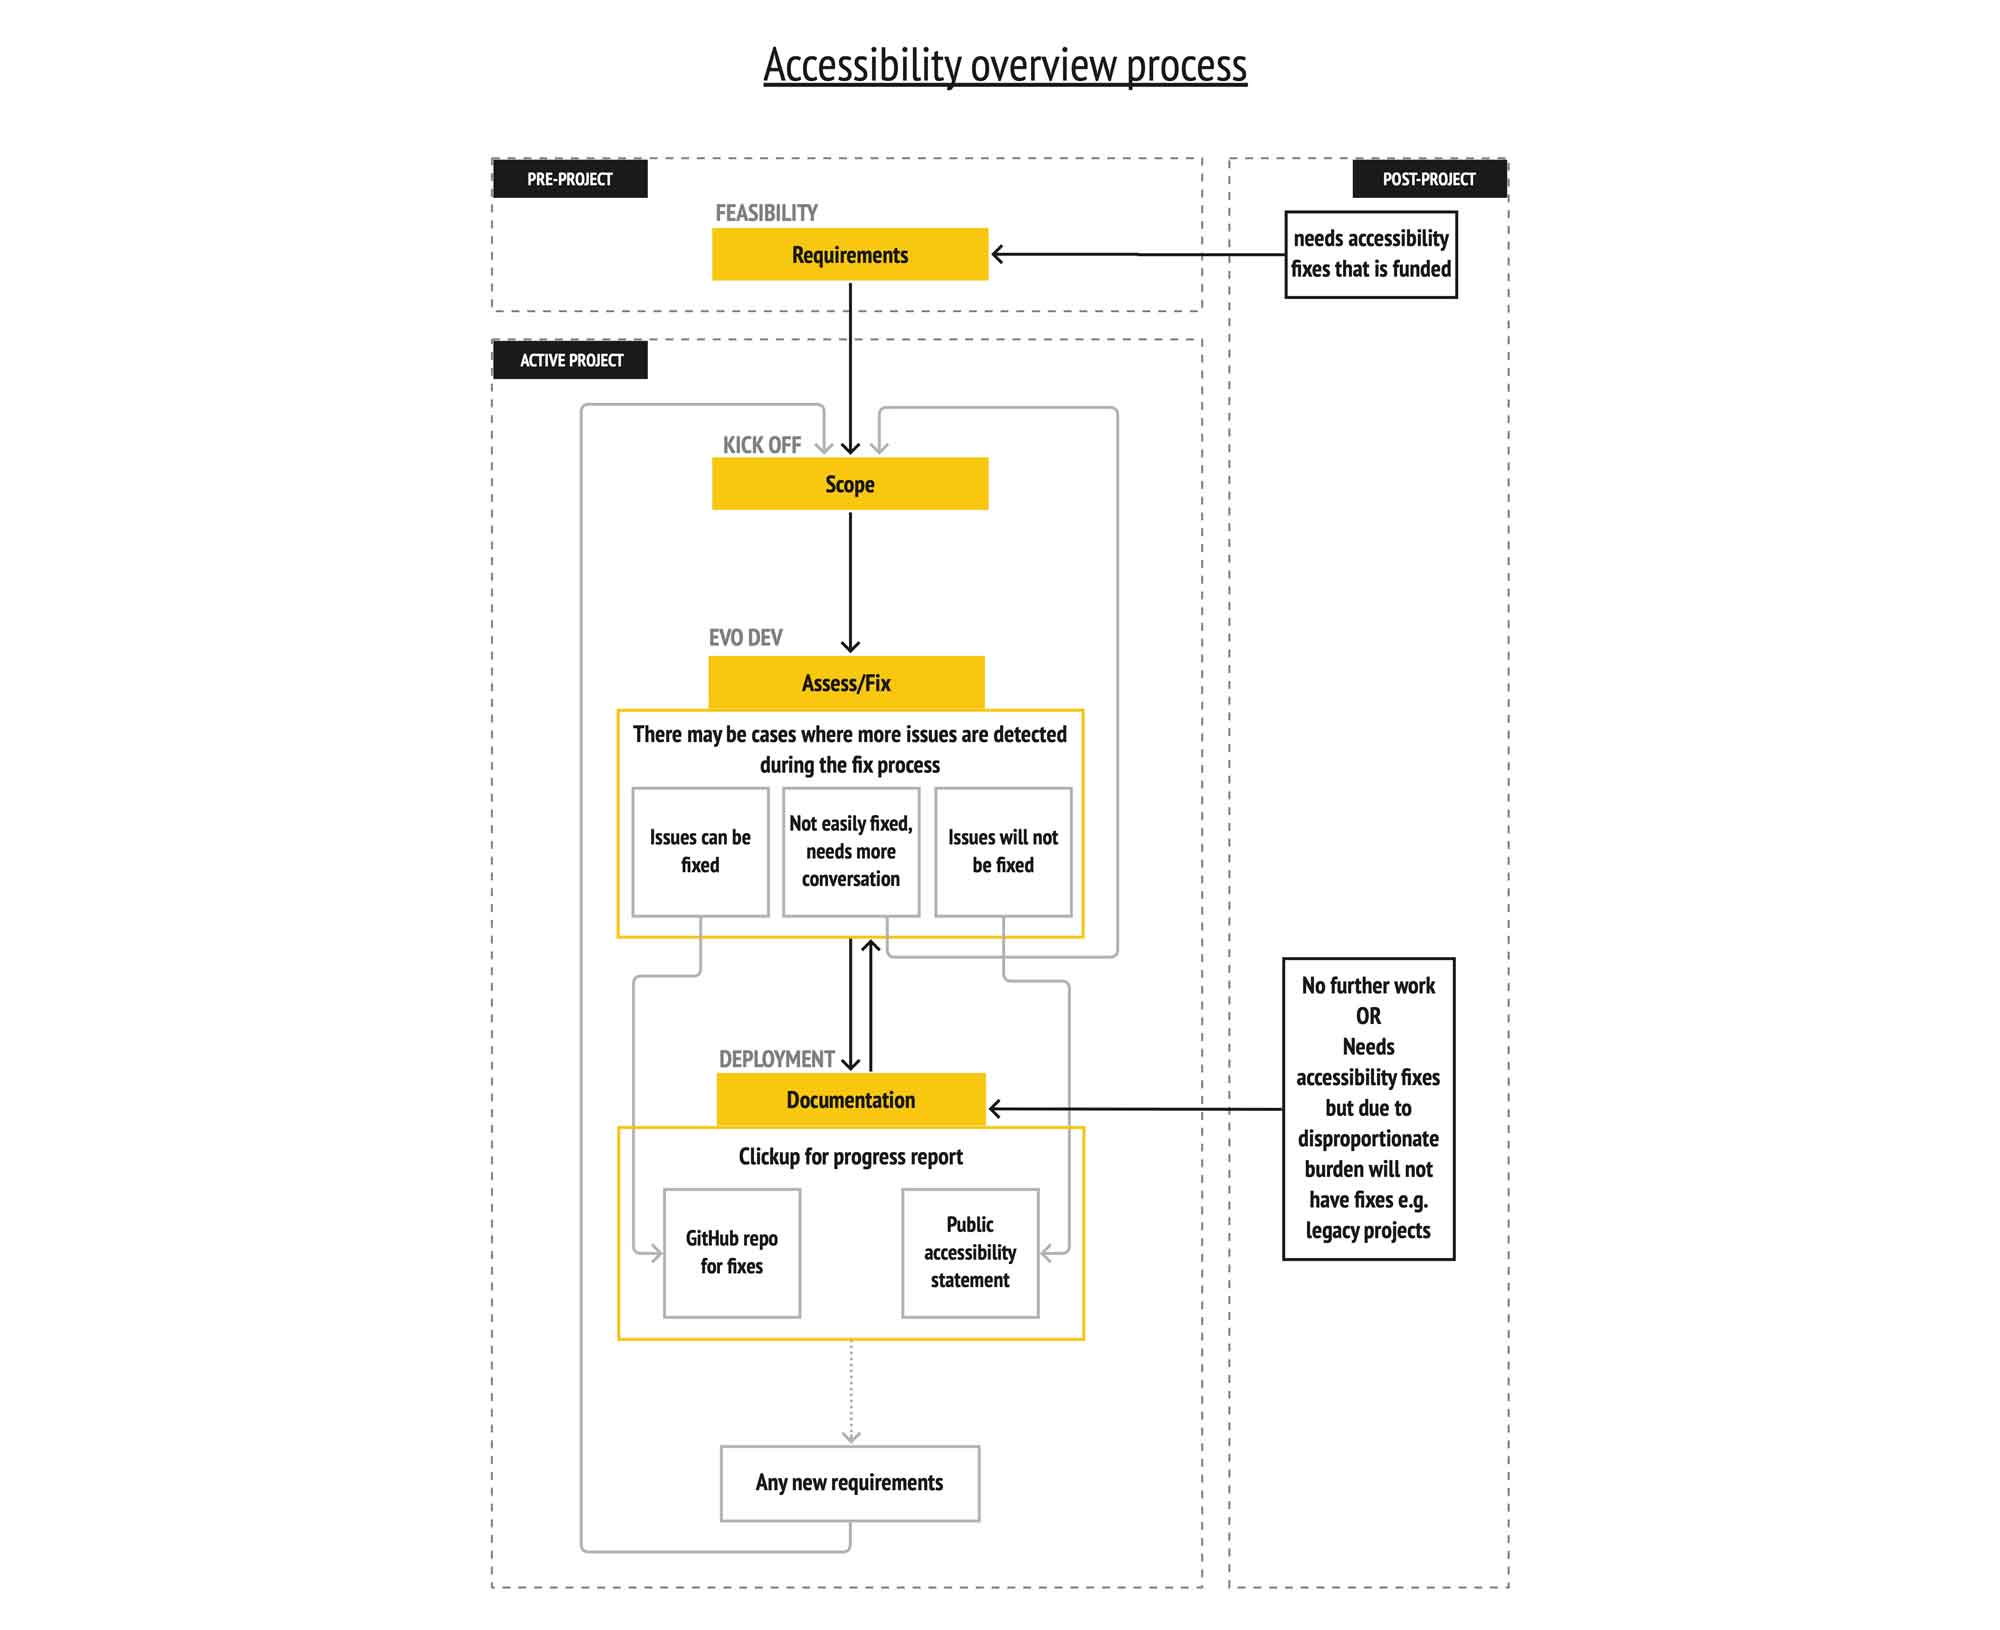
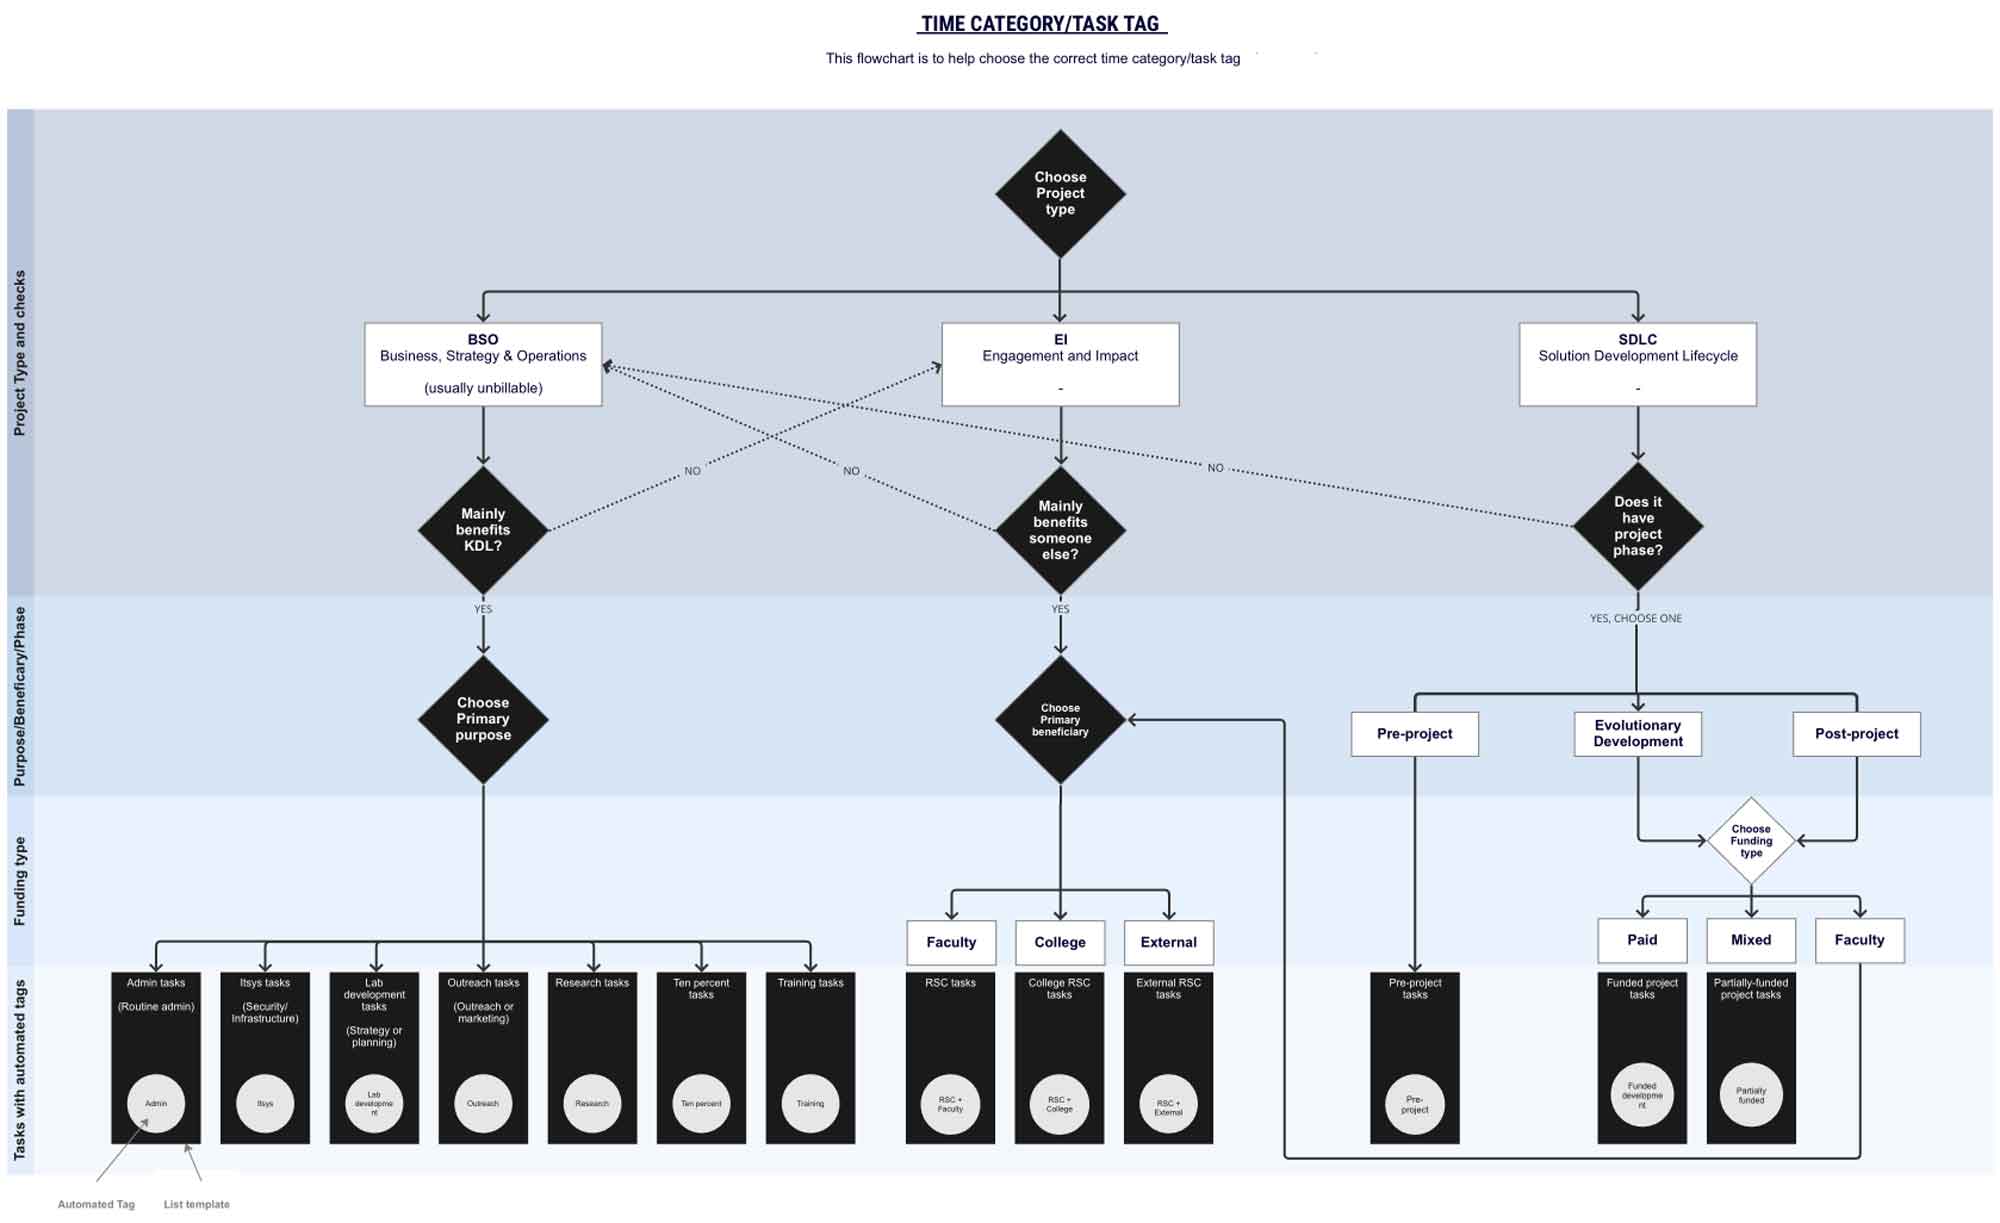
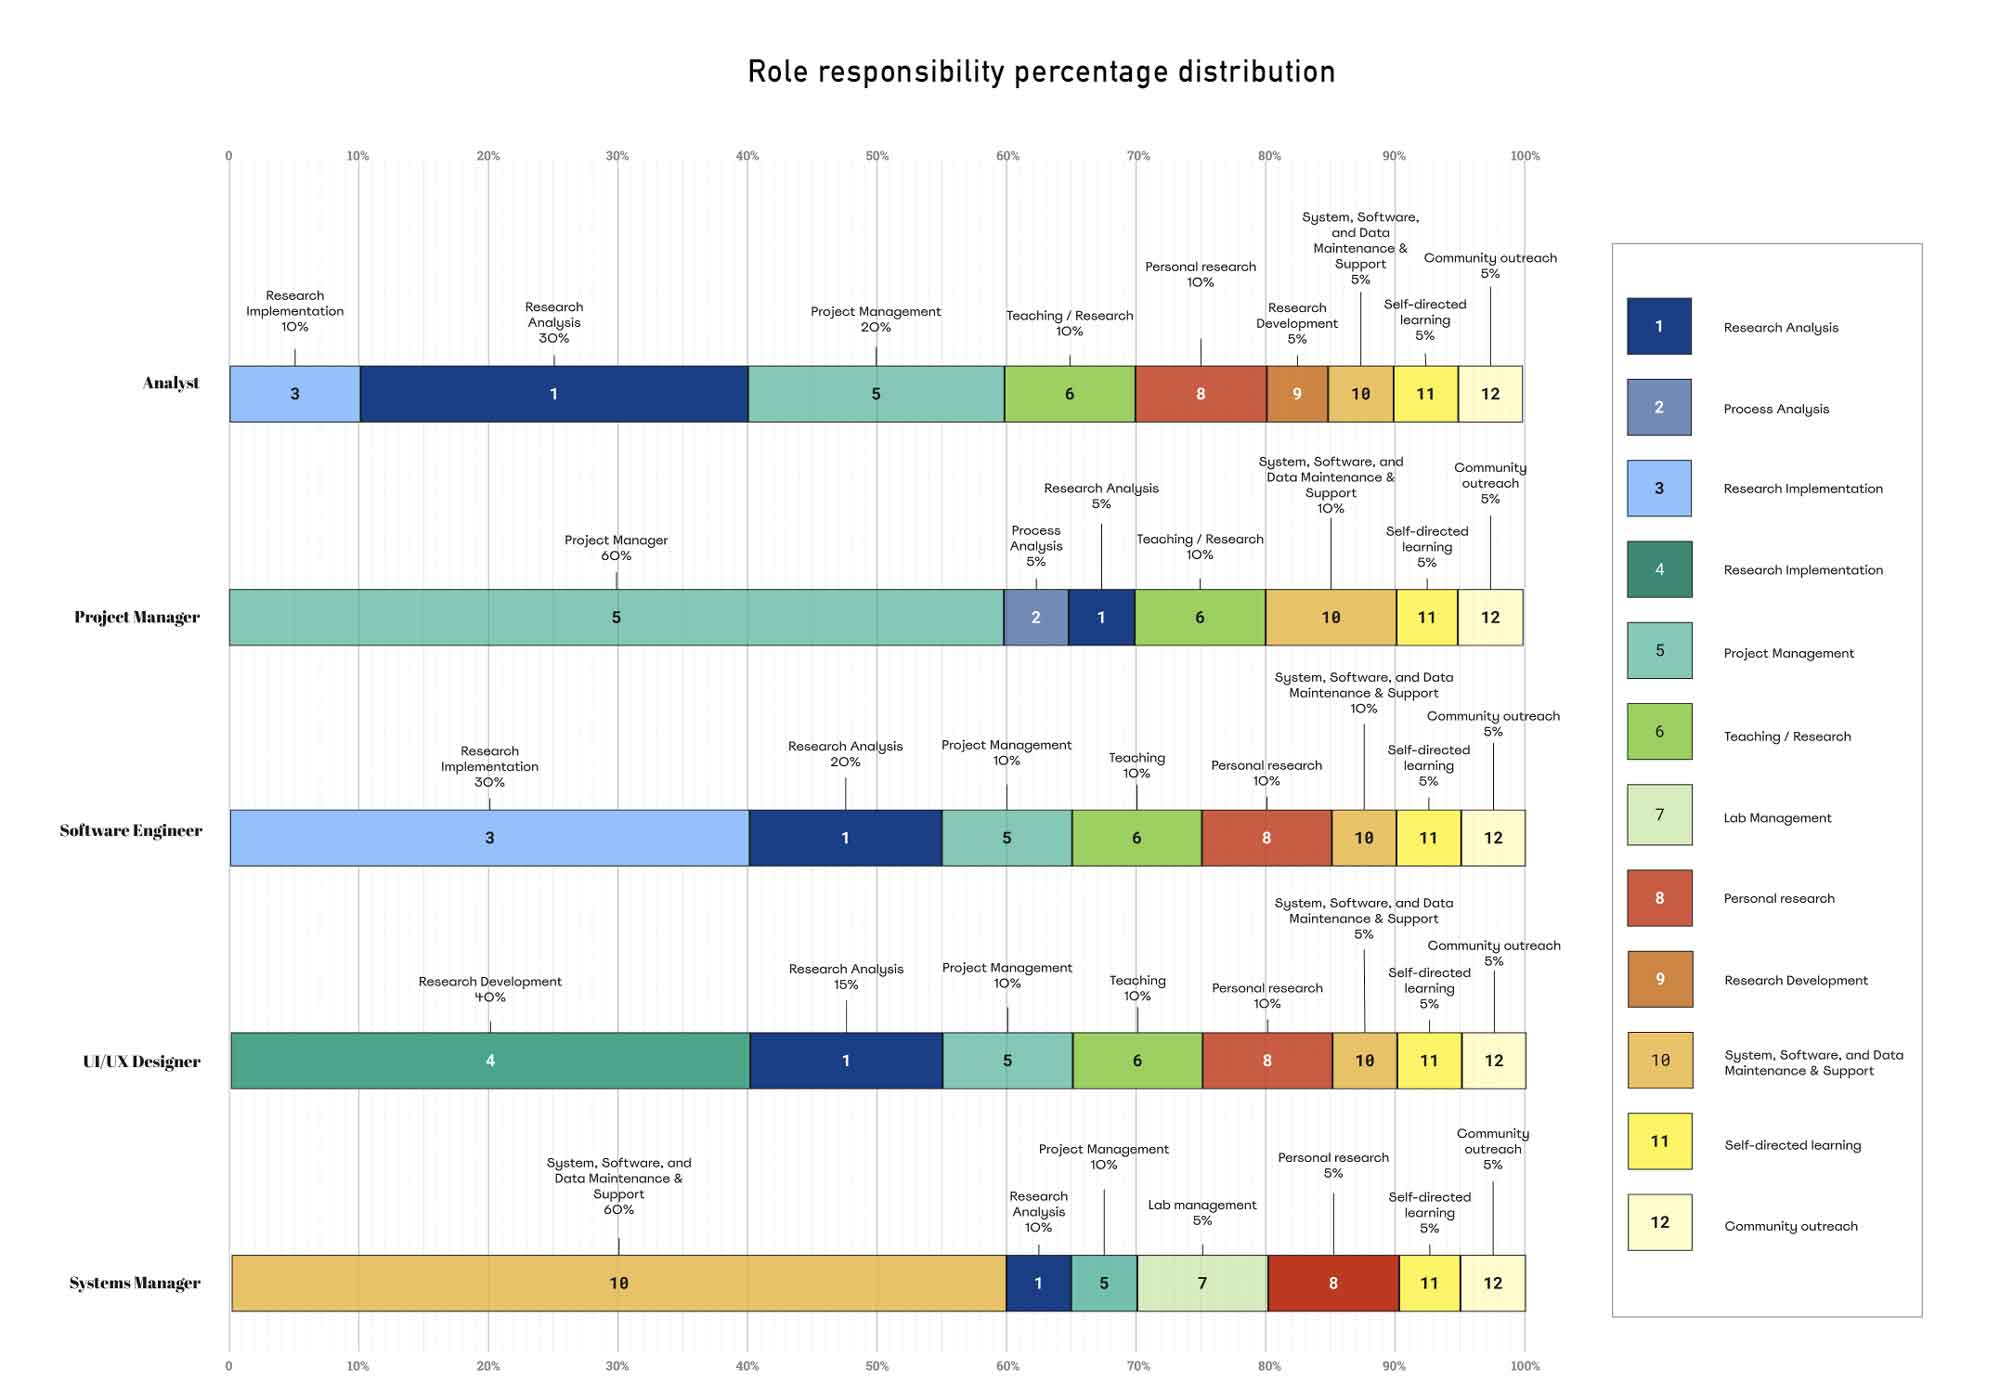
To streamline workflows and improve communication among internal colleagues at King's Digital Lab, visual representations are created when needed. These diagrams aimed to aid understanding across teams and ensure alignment between lab managers, analysts, developers or between project partners and other researchers.
The primary goal of these digrams was to develop clear, user-friendly diagrams to represent workflows, enhancing collaboration, efficiency and clarity.
Collaborative Process
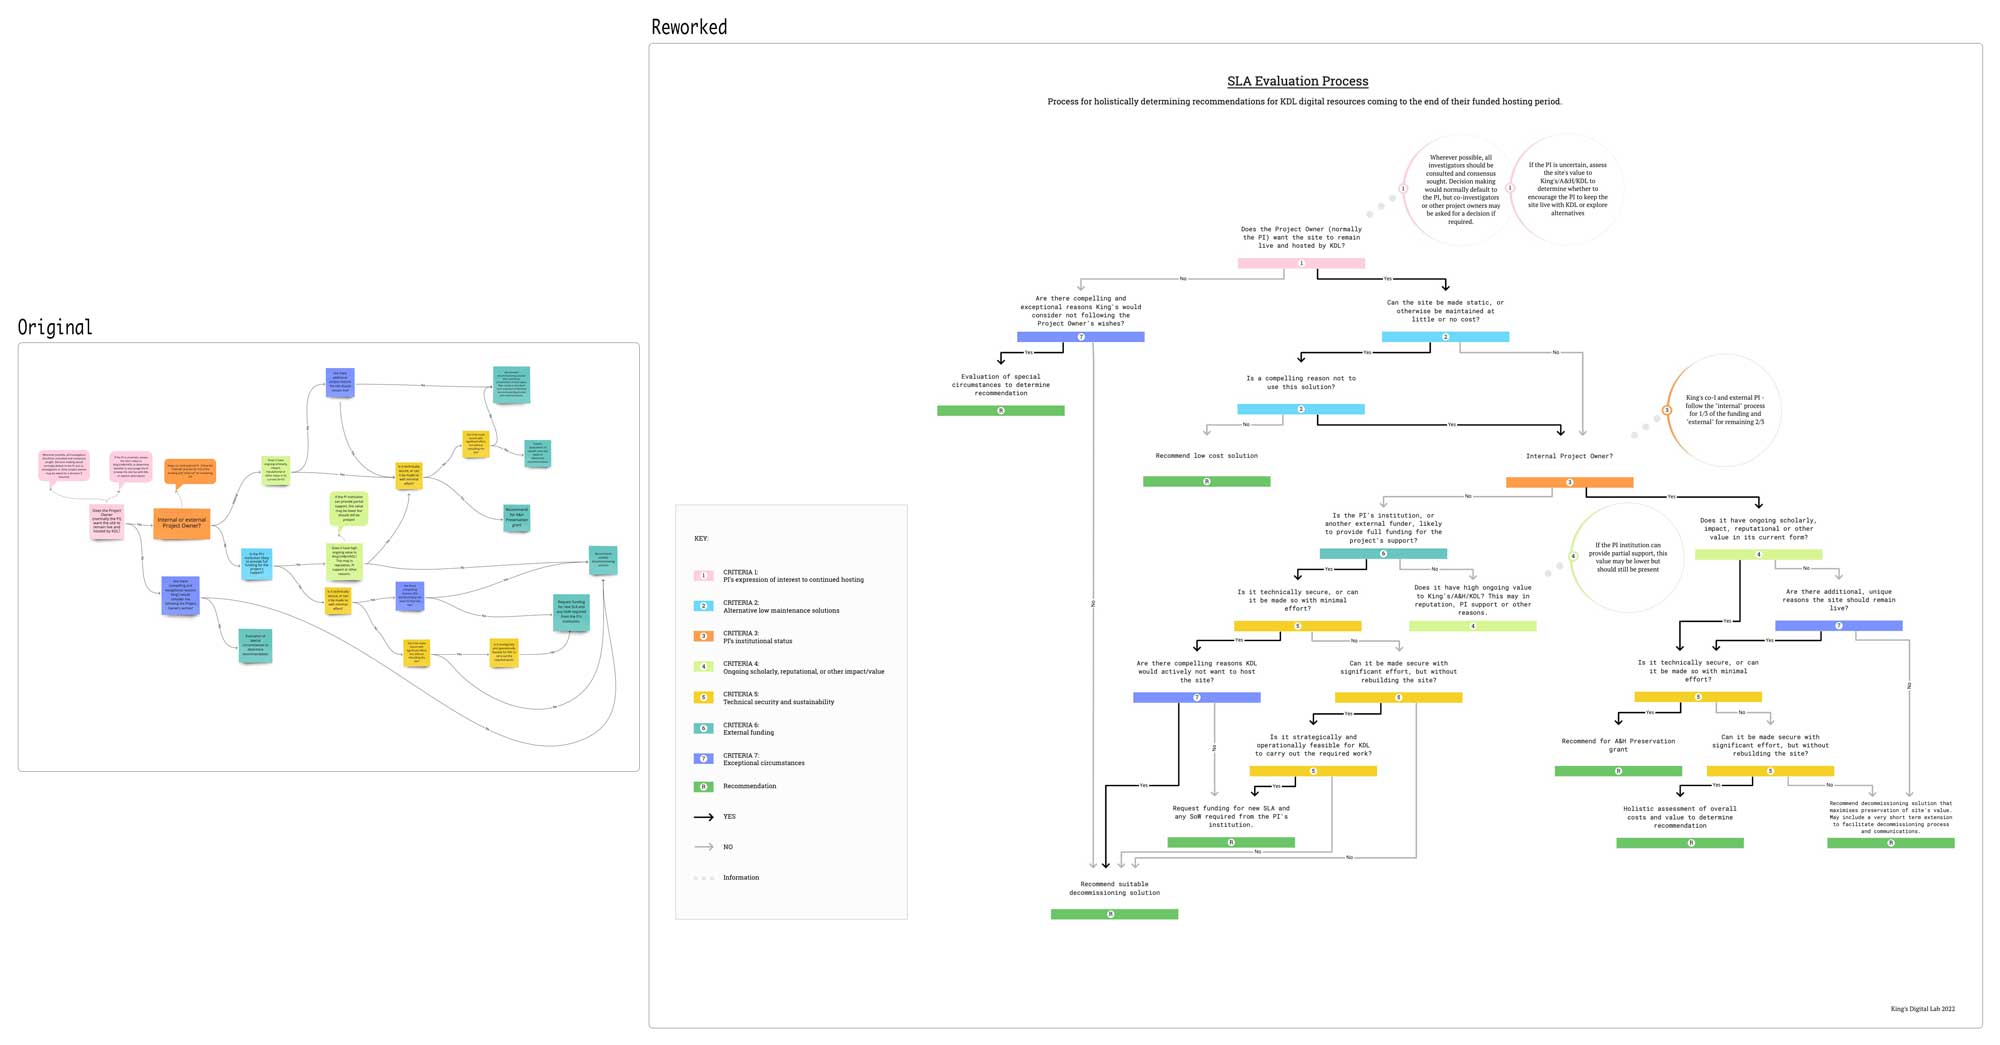
It usually starts with collaborative discussions using Miro as the primary tool for drawing and brainstorming. Contributions from the lab manager, analysts, and developers played a key role in shaping the diagrams, ensuring accuracy and relevance to the specific applications being developed. The iterative feedback loop between team members was crucial for refining the content and format of the visuals.