Project:
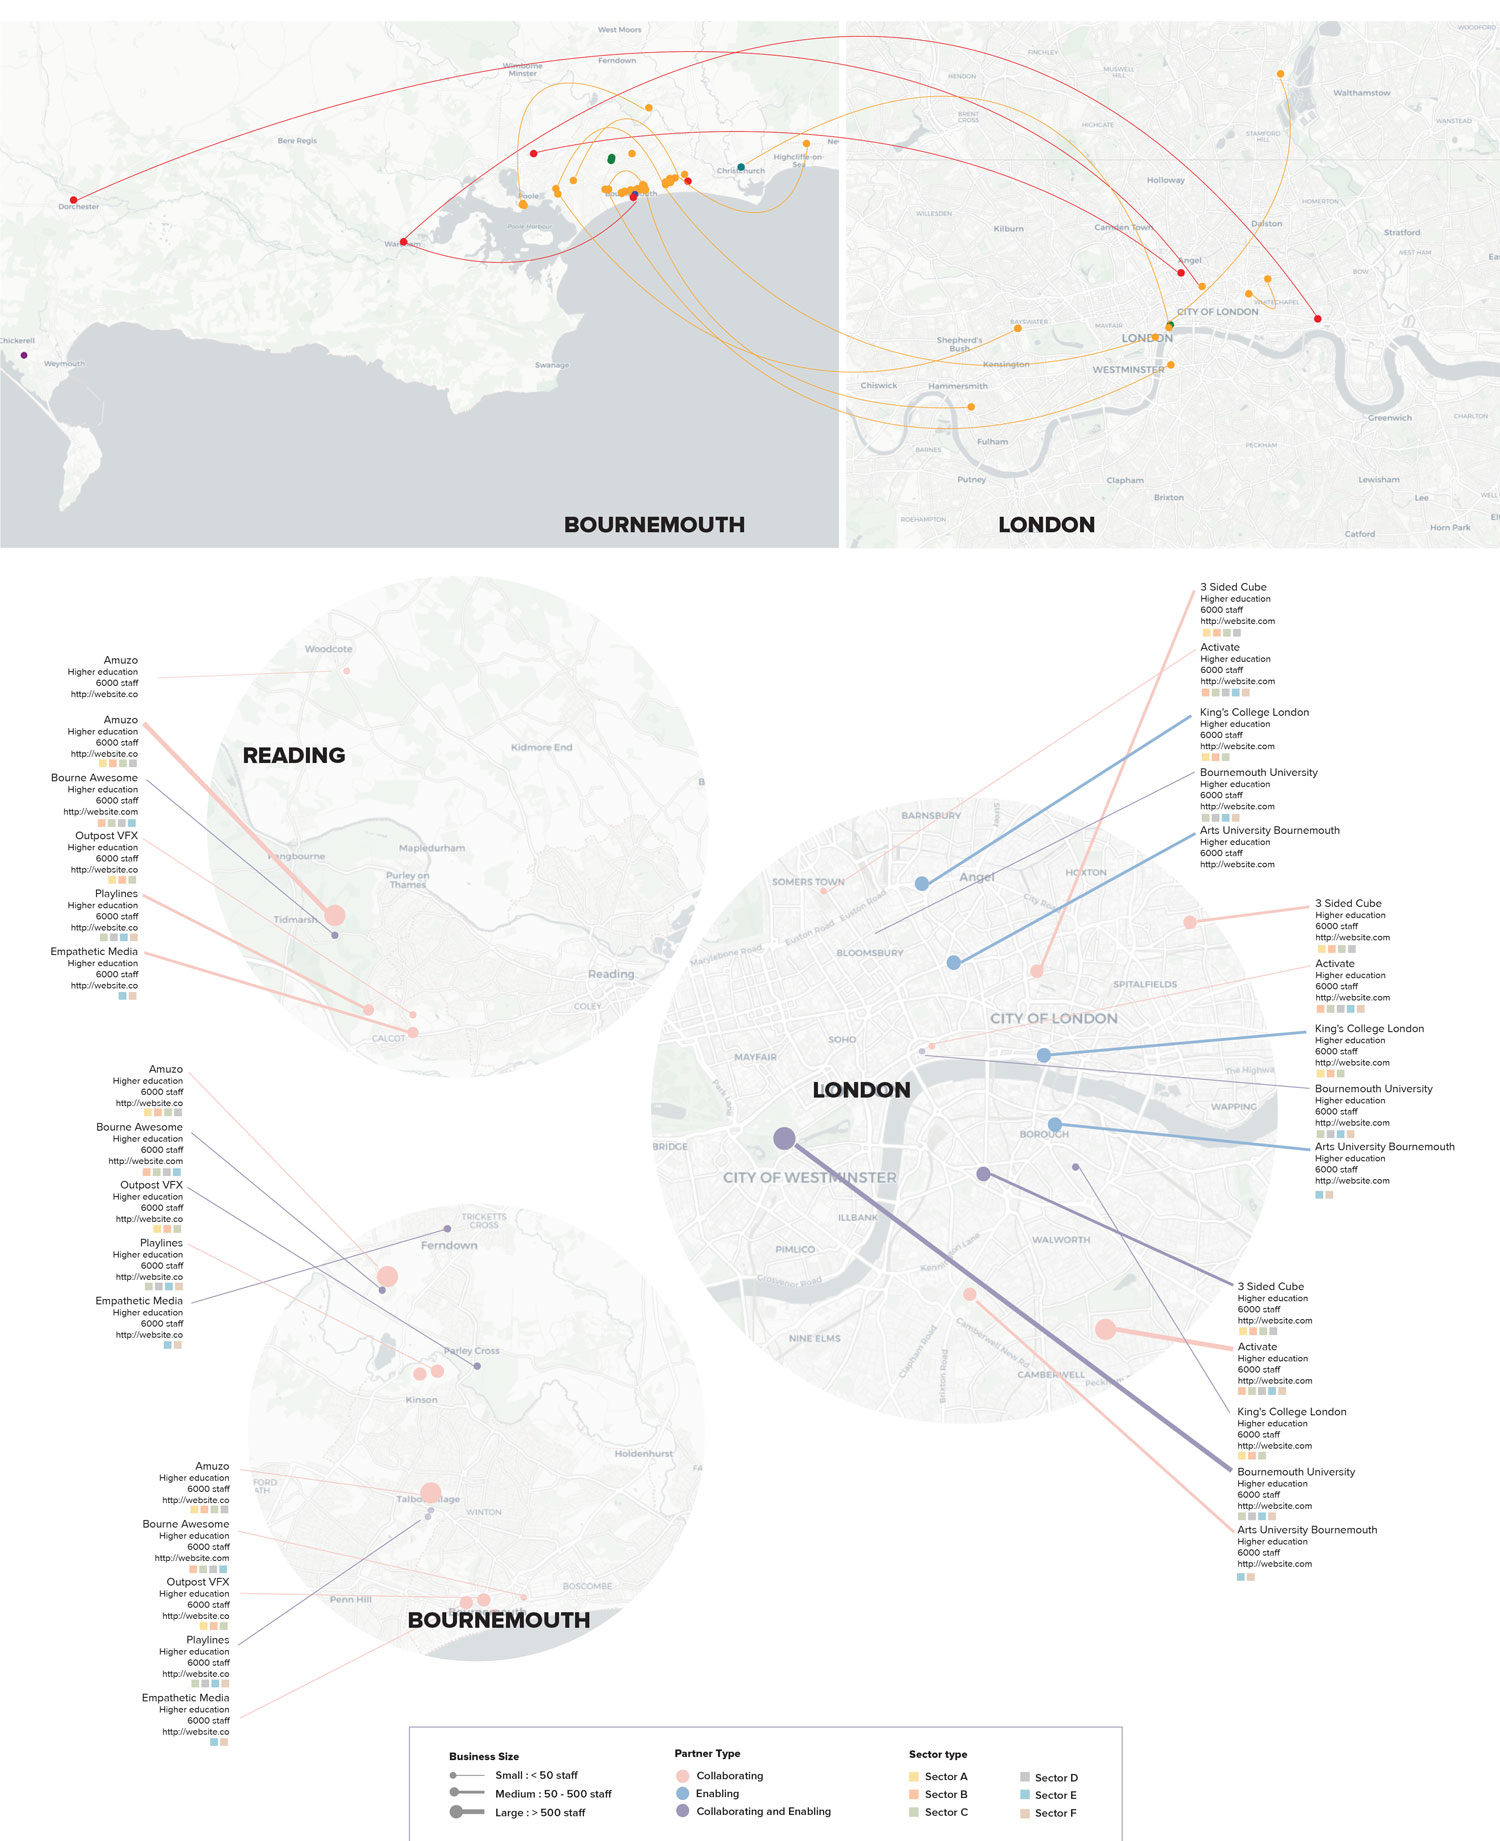
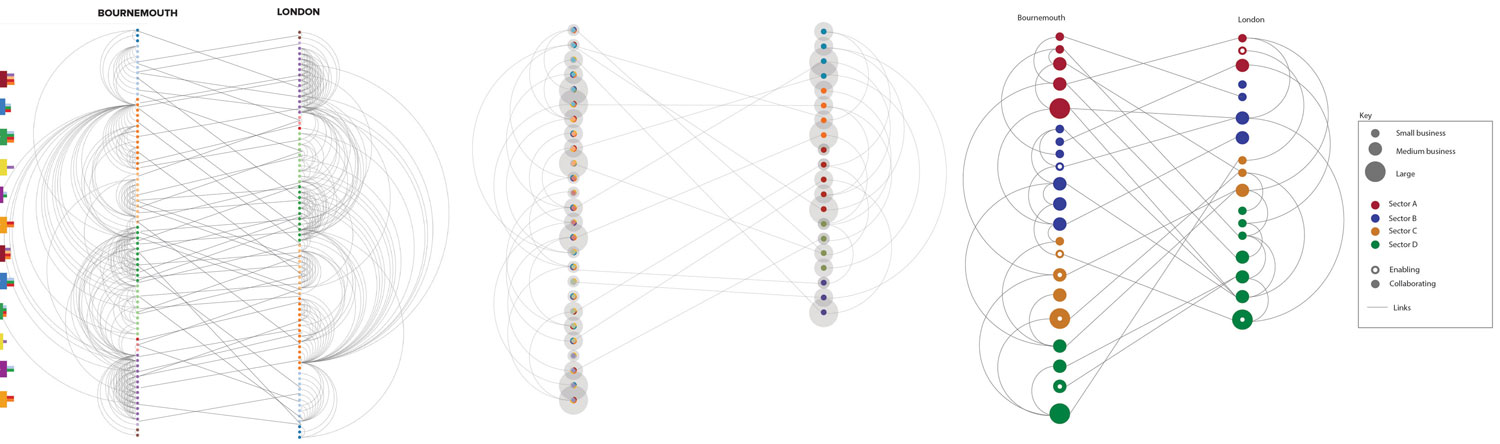
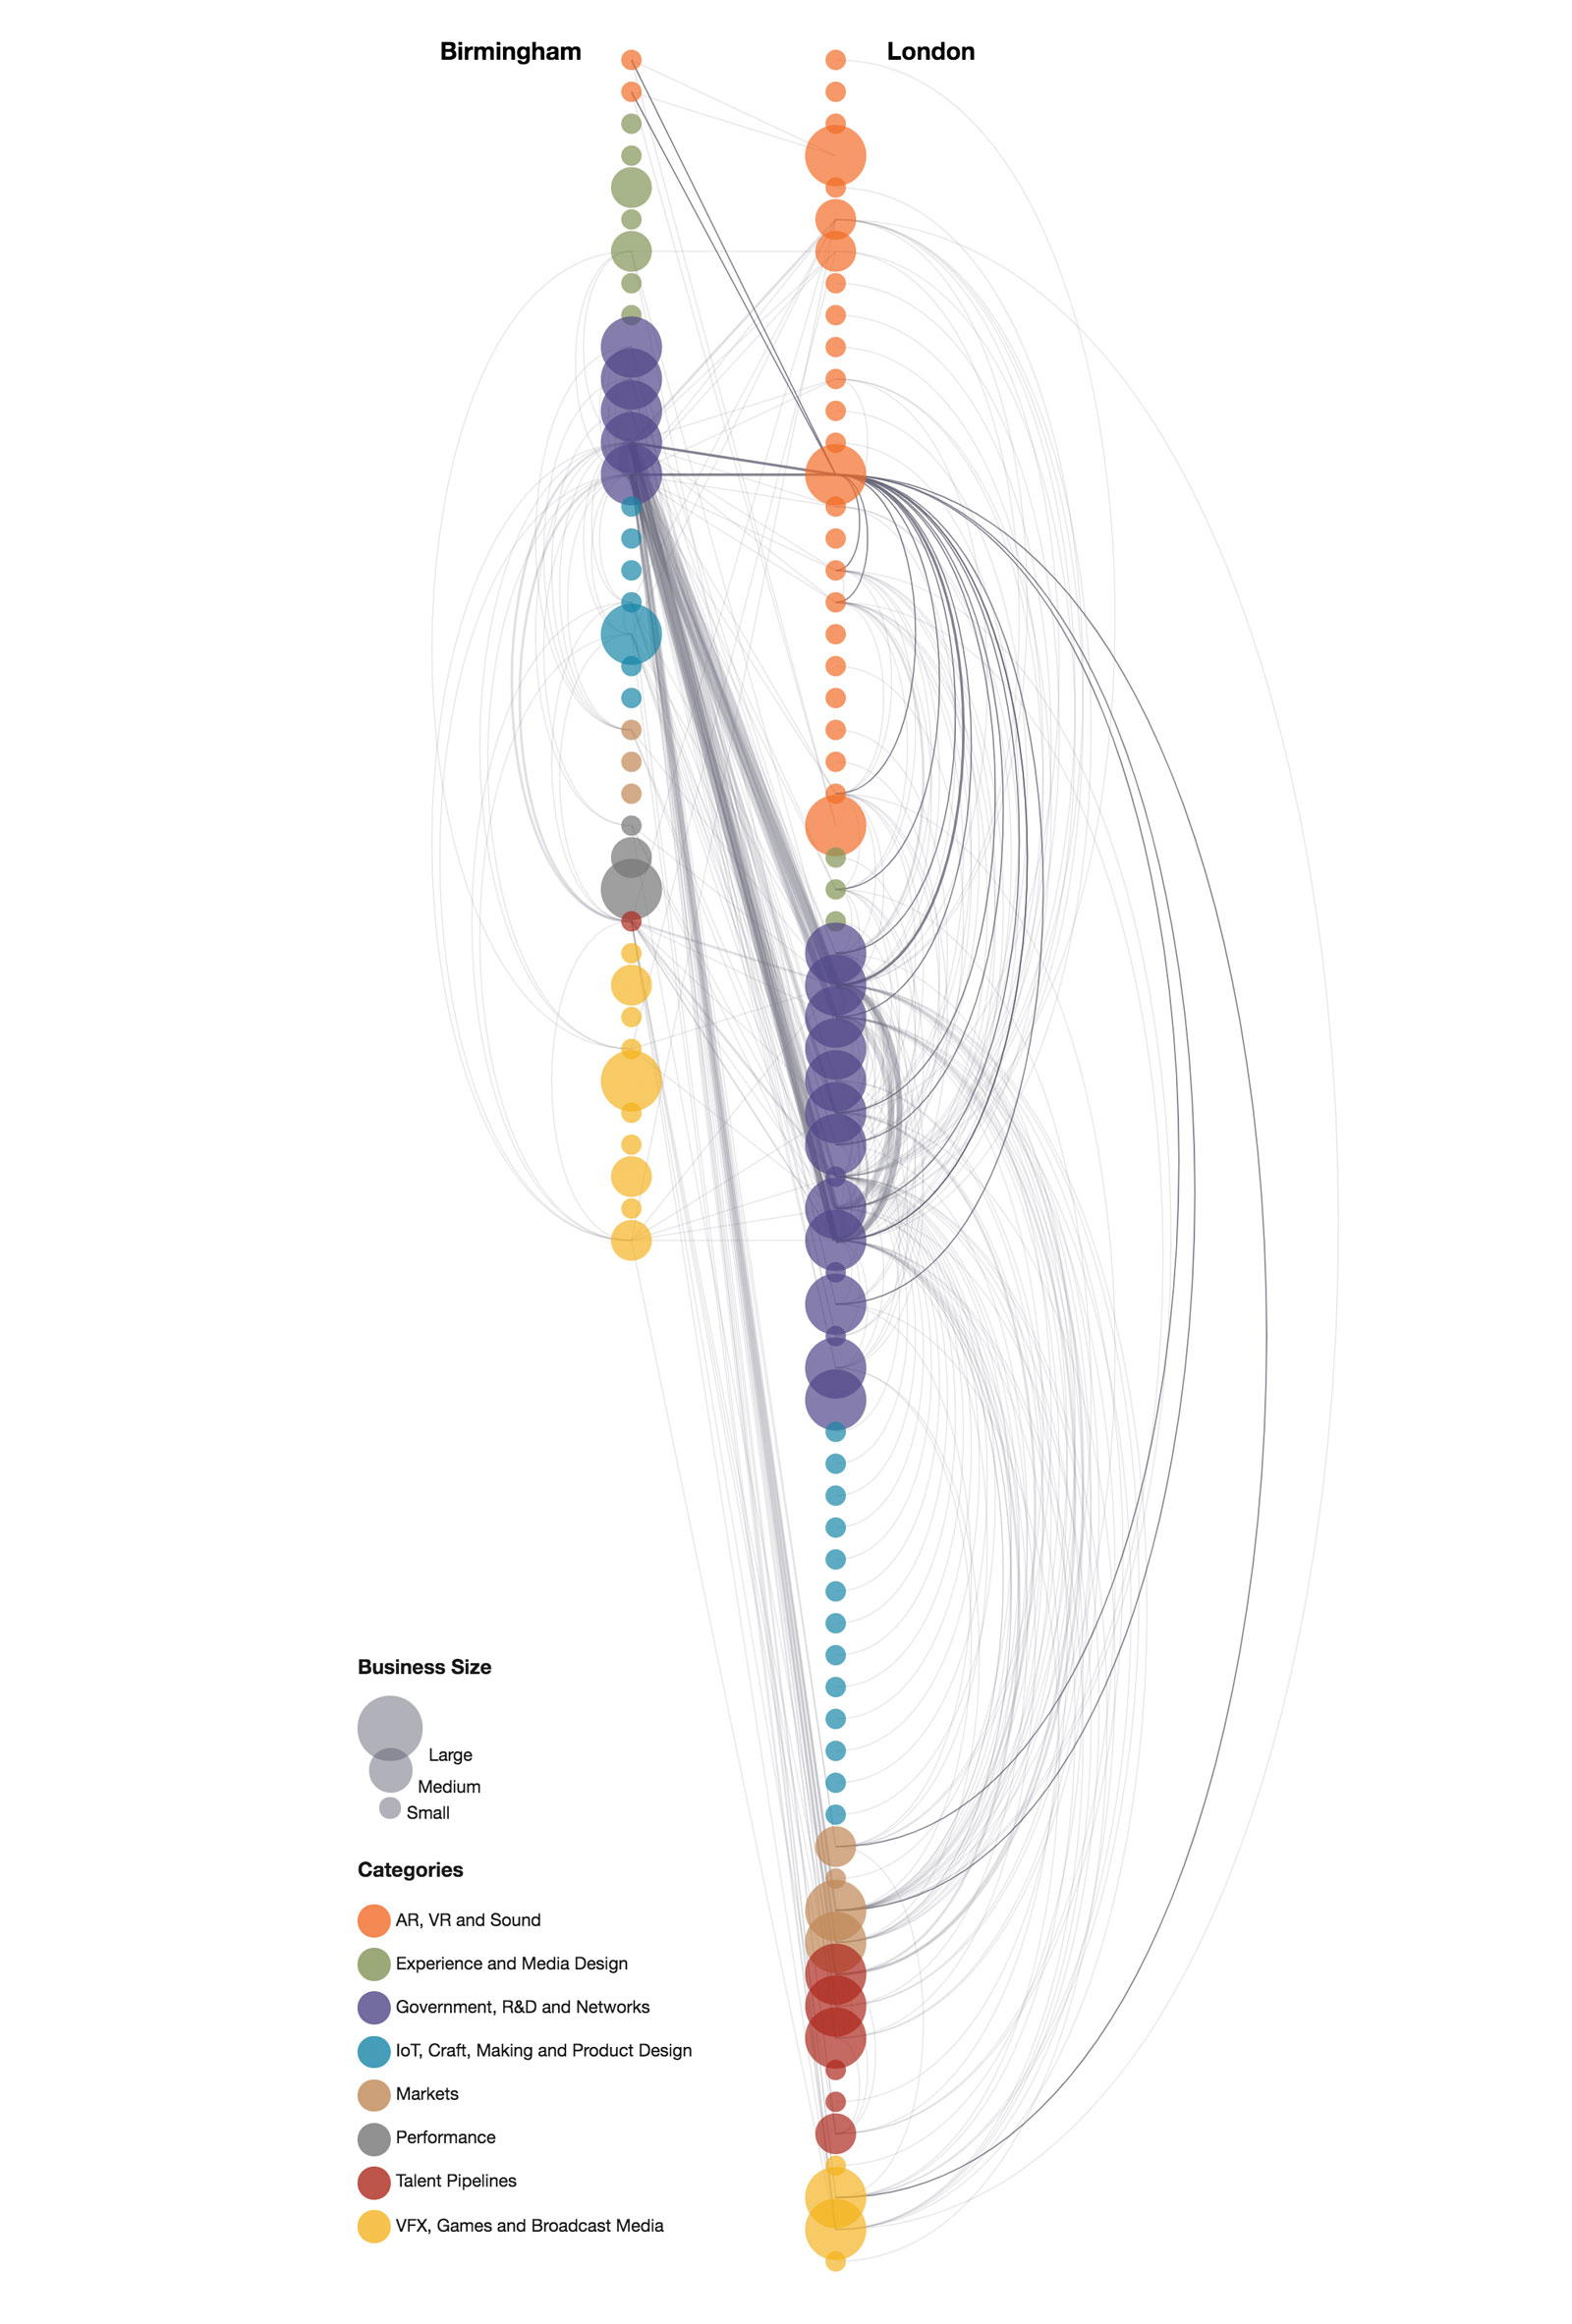
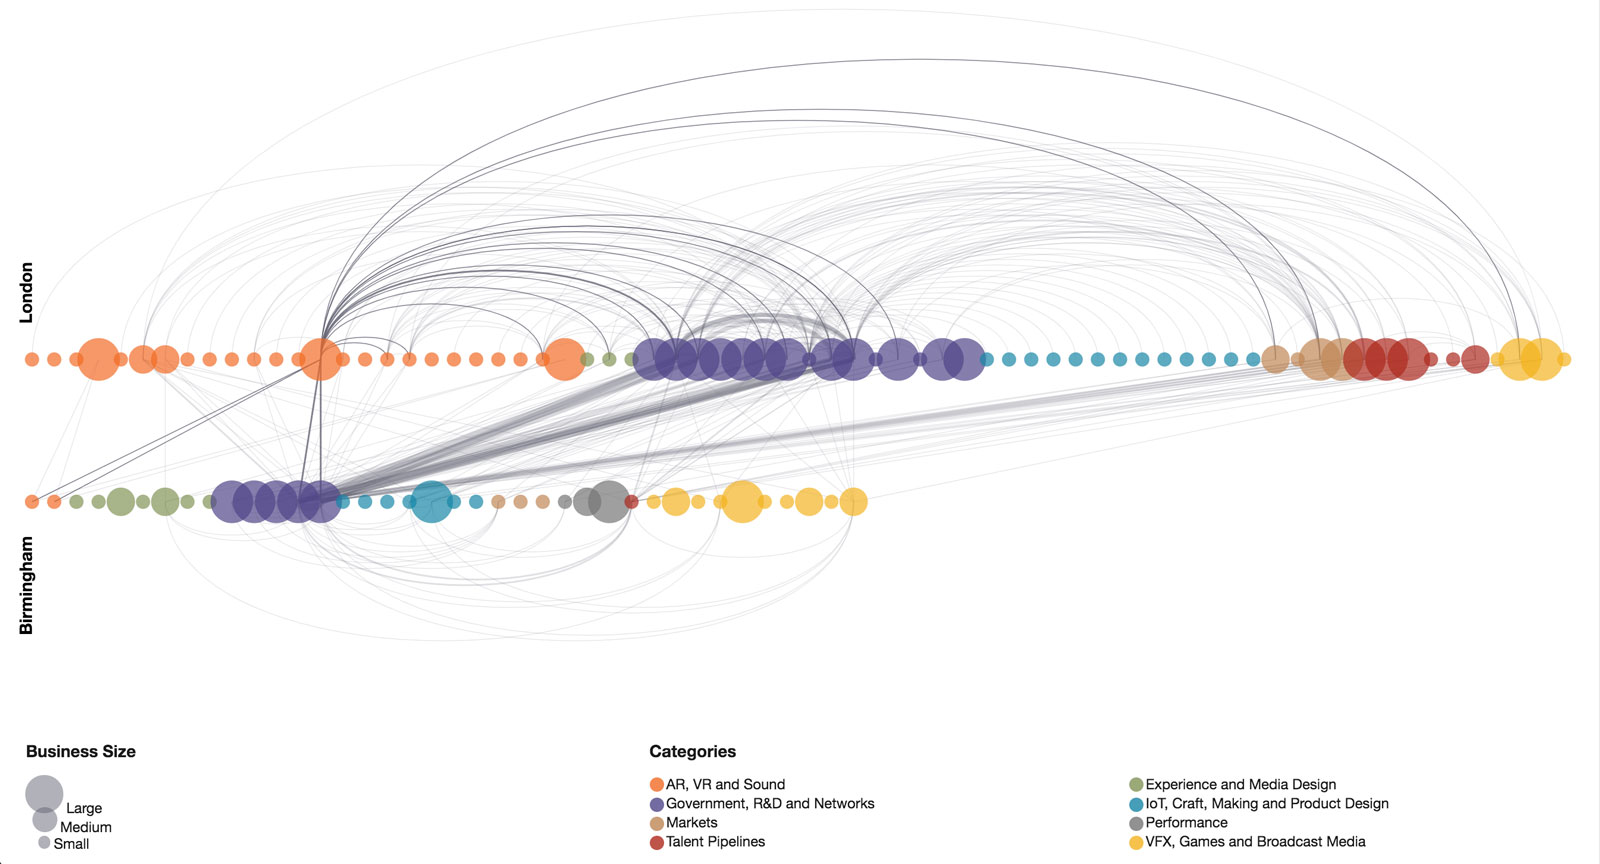
Using data from a closely interconnected cluster of creative digital experts, geographically focused on London and Bournemouth, engaged in cross-cutting collaborative projects, and deeply embedded in our local communities. The visualisation shows the partnership connections that have sprung naturally from existing relationships and projects.
Process:
This was a quick project to illustrate connections to enhance a funding bid. I was the designer, working with a developer, director and other funding partners. The chart could have been interactive to show more detail but due to the application, they decided to not show more information. The developer used D3.js to implement the final chart.